
 #1 of 23
#1 movie of Week 6, 2012
Journey 2: The Mysterious Island (2012)
2012 · Action, Adventure
$335.3M worldwide · 43% of the chart's total
$103.9M US & Canada · 31% $231.4M elsewhere · 69%
Journey 2: The Mysterious Island (2012) is the highest-grossing movie released in week 6 of 2012 (Feb 5–11), with $335.3M worldwide, ahead of Safe House (2012) at $208.1M and The Vow (2012) at $196.1M. 23 films released that week report a worldwide gross, $778.8M in all, 46% of it from the US & Canada. 3 films crossed $100 million; none reached $1 billion. That is up 161% on Week 5, 2012, whose releases took $298.5M. By genre, Action leads with $544.9M across 3 releases.
#1 of 23 Journey 2: The Mysterious Island (2012)
2012 · Action, Adventure
$335.3M worldwide · 43% of the chart's total
Journey 2: The Mysterious Island (2012) leads with $335.3M, 43% of the total. The top 5 together took $760M, 98% of what all 23 films earned. Each bar splits a film's gross into the US & Canada and the rest of the world.
Number 1  Number 2
 Number 3
 Number 4
 Number 5
US & Canada (domestic) Rest of the world
Lifetime worldwide grosses in US dollars, not adjusted for inflation; domestic means the US & Canada. Films are grouped by their release date in week 6 of 2012 (Feb 5–11).
 Feb 10, 2012 · English · Action, Adventure $335.3M worldwide Feb 10, 2012 US and Canada: $126.4M Rest of the world: $81.7M Worldwide: $208.1M Feb 10, 2012 US and Canada: $125M Rest of the world: $71.1M Worldwide: $196.1M Feb 10, 2012 US and Canada: – Rest of the world: – Worldwide: $10.6M Feb 10, 2012 US and Canada: $1M Rest of the world: $8.9M Worldwide: $10M
 Feb 10, 2012 US and Canada: – Rest of the world: – Worldwide: $3.1M
 Feb 10, 2012 US and Canada: $1.2M Rest of the world: $1.1M Worldwide: $2.3M
 Feb 9, 2012 US and Canada: – Rest of the world: – Worldwide: $2M
 Feb 9, 2012 · English · Animation $1.7M worldwide
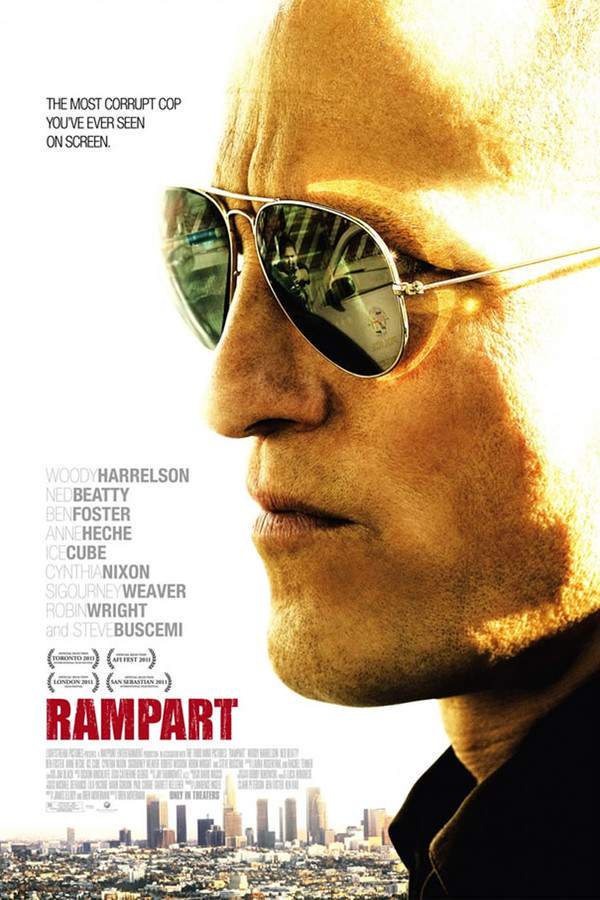 Feb 10, 2012 US and Canada: $972.5K Rest of the world: $595.4K Worldwide: $1.6M
 Feb 9, 2012 US and Canada: – Rest of the world: – Worldwide: $1.5M
 Feb 9, 2012 US and Canada: – Rest of the world: – Worldwide: $1.4M
 Feb 10, 2012 US and Canada: – Rest of the world: – Worldwide: $1.1M
 Feb 9, 2012 US and Canada: – Rest of the world: – Worldwide: $998.3K
 Feb 10, 2012 US and Canada: – Rest of the world: – Worldwide: $993.3K
 Feb 9, 2012 US and Canada: – Rest of the world: – Worldwide: $865K
 Feb 10, 2012 US and Canada: $562.2K Rest of the world: $21.6K Worldwide: $583.8K
 Feb 8, 2012 US and Canada: – Rest of the world: – Worldwide: $303.1K
 Feb 10, 2012 US and Canada: $56.4K Rest of the world: $105.7K Worldwide: $162.1K
 Feb 8, 2012 US and Canada: – Rest of the world: – Worldwide: $86.4K
 Feb 11, 2012 US and Canada: – Rest of the world: – Worldwide: $47.7K
 Feb 11, 2012 US and Canada: – Rest of the world: – Worldwide: $41.2K
 Feb 8, 2012 US and Canada: – Rest of the world: – Worldwide: $37.2K
Of the top 10, The Oscar Nominated Short Films 2012: Animation (2012) earned the biggest share at home (100% in the US & Canada), while In Darkness (2012) made 90% of its gross abroad. Across all 23 films, $360.8M (46%) came from the US & Canada. 3 films of the top 10 report no US & Canada figure.
3 of 23 films crossed $100M and took $739.5M between them, 95% of the total. 19 films, 83% of the list, earned under $10M.
Week 6 releases took $778.8M. The biggest of these 9 weeks is week 6 (Feb 5–11) with $778.8M, led by Journey 2: The Mysterious Island (2012).
Of these 10 years, Week 6, 2012 earned the most: $778.8M from 23 films, led by Journey 2: The Mysterious Island (2012).
| Week | Films | Worldwide | Change | Biggest film |
|---|---|---|---|---|
| Week 6, 2003 Feb 2–8 12 films | 12 | $322.7M | – | How to Lose a Guy in 10 Days (2003) $177.5M |
| Week 6, 2004 Feb 1–7 20 films · −34% | 20 | $212.2M | −34% | Barbershop 2: Back in Business (2004) $66M |
| Week 6, 2005 Jan 30–Feb 5 14 films · −34% | 14 | $139.9M | −34% | Boogeyman (2005) $67.2M |
| Week 6, 2006 Feb 5–11 20 films · +232% | 20 | $464.7M | +232% | The Pink Panther (2006) $164.1M |
| Week 6, 2007 Feb 4–10 26 films · −24% | 26 | $351.5M | −24% | Norbit (2007) $159.8M |
| Week 6, 2008 Feb 3–9 29 films · −7% | 29 | $327.7M | −7% | Fool's Gold (2008) $111.2M |
| Week 6, 2009 Feb 1–7 30 films · +118% | 30 | $715.2M | +118% | Coraline (2009) $185.9M |
| Week 6, 2010 Jan 31–Feb 6 19 films · −65% | 19 | $252.3M | −65% | Dear John (2010) $115M |
| Week 6, 2011 Jan 30–Feb 5 29 films · +14% | 29 | $288.3M | +14% | Sanctum (2011) $108.6M |
| Week 6, 2012 Feb 5–11 23 films · +170% | 23 | $778.8M | +170% | Journey 2: The Mysterious Island (2012) $335.3M |
Action took $544.9M across 3 films, 70% of the total, ahead of Family ($338.5M) and Adventure ($335.3M). A film counts once for each of its genres. English-language films took $766.7M across 11 films, 98% of the total, ahead of Finnish-language films ($3.1M) and Hindi-language films ($2.3M).















53 weeks of 2012 with reported grosses; the biggest is week 18 (Apr 29–May 5) with $1.7B, led by The Avengers (2012).
The chart's numbers in short: the #1 film, the total, the billion-dollar hits and the US & Canada share, answered from the same 23 films as the chart.
Journey 2: The Mysterious Island (2012) leads with $335.3M worldwide, $103.9M of it in the US & Canada. Next come Safe House (2012) at $208.1M and The Vow (2012) at $196.1M.
23 films released in week 6 of 2012 (Feb 5–11) report a worldwide gross, $778.8M in all, or $33.9M per film on average. Week 5, 2012 releases took $298.5M.
None. 3 films crossed $100 million, led by Journey 2: The Mysterious Island (2012) with $335.3M.
Films are ranked by lifetime worldwide gross in US dollars, not adjusted for inflation, and grouped by their release date in week 6 of 2012 (Feb 5–11). The figures are the reported box office grosses in our database. A gross that looks misattributed, such as one figure shared by two unrelated films or a blockbuster total on an obscure title, is left out rather than shown as a fact.
Grosses change while films are in theaters and whenever a new figure is reported; this chart reads the latest numbers in our database, so an older film can still move after a re-release.

