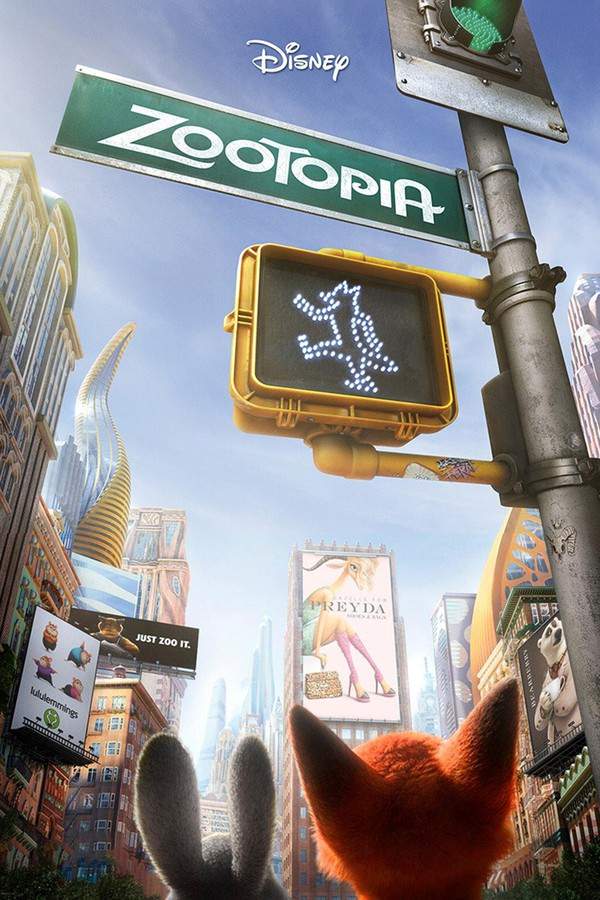
 #1 of 140
#1 movie of March 2016
2016 · Action, Adventure
$1B worldwide · 36% of the chart's total
$341.3M US & Canada · 33% $684.3M elsewhere · 67%
Zootopia (2016) is the highest-grossing movie released in March 2016, with $1B worldwide, ahead of Batman v Superman: Dawn of Justice (2016) at $874.4M and London Has Fallen (2016) at $205.8M. 140 films released in March 2016 report a worldwide gross, $2.9B in all, 36% of it from the US & Canada. 1 film crossed $1 billion and 4 crossed $100 million. That is up 41% on February 2016, whose releases took $2B. By genre, Action leads with $2.3B across 18 releases.
#1 of 140 2016 · Action, Adventure
$1B worldwide · 36% of the chart's total
Zootopia (2016) leads with $1B, 36% of the total. The top 5 together took $2.3B, 81% of what all 140 films earned. Each bar splits a film's gross into the US & Canada and the rest of the world.
Number 1  Number 2
 Number 3
 Number 4
 Number 5
US & Canada (domestic) Rest of the world
Ranks 1 to 50 of 140. Lifetime worldwide grosses in US dollars, not adjusted for inflation; domestic means the US & Canada. Films are grouped by their release date in March 2016.
Mar 4, 2016 US and Canada: $341.3M Rest of the world: $684.3M Worldwide: $1B  Mar 25, 2016 · English · Action, Adventure $874.4M worldwide Mar 4, 2016 US and Canada: $62.5M Rest of the world: $143.2M Worldwide: $205.8M Mar 11, 2016 US and Canada: $72.1M Rest of the world: $38.1M Worldwide: $110.2M Mar 25, 2016 US and Canada: $59.7M Rest of the world: $30.9M Worldwide: $90.6M
 Mar 16, 2016 US and Canada: $61.7M Rest of the world: $12.4M Worldwide: $74.1M
 Mar 10, 2016 US and Canada: $149.8K Rest of the world: $59.8M Worldwide: $60M

 Mar 5, 2016 · Japanese · Animation, Family $50.9M worldwide
 Mar 11, 2016 US and Canada: $18.7M Rest of the world: $16.6M Worldwide: $35.3M
 Mar 25, 2016 · Japanese · Action, Comedy $31.4M worldwide
 Mar 11, 2016 US and Canada: $6.9M Rest of the world: $21.1M Worldwide: $28M
 Mar 4, 2016 US and Canada: $23.1M Rest of the world: $1.9M Worldwide: $25M
 Mar 18, 2016 US and Canada: $201.2K Rest of the world: $20.2M Worldwide: $20.4M
 Mar 18, 2016 US and Canada: $2.6M Rest of the world: $14.8M Worldwide: $17.4M
 Mar 11, 2016 US and Canada: $14.4M Rest of the world: $214.4K Worldwide: $14.7M
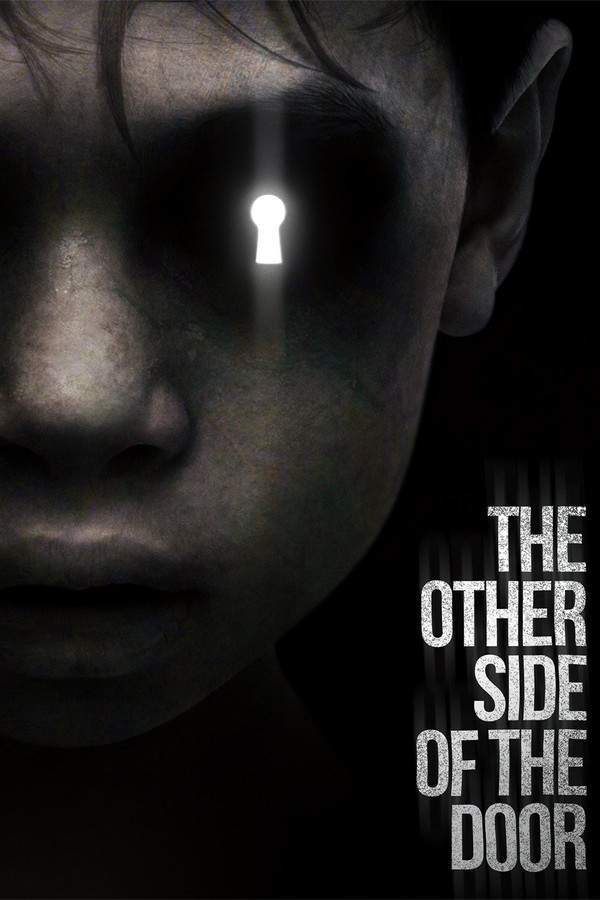 Mar 4, 2016 US and Canada: $3M Rest of the world: $11.3M Worldwide: $14.3M
 Mar 4, 2016 US and Canada: $177.4K Rest of the world: $12.8M Worldwide: $13M
 Mar 19, 2016 US and Canada: – Rest of the world: – Worldwide: $12.1M
 Mar 11, 2016 US and Canada: $9.7M Rest of the world: $745.2K Worldwide: $10.4M
 Mar 17, 2016 US and Canada: – Rest of the world: – Worldwide: $10M
 Mar 12, 2016 US and Canada: – Rest of the world: – Worldwide: $9.9M
 Mar 18, 2016 US and Canada: – Rest of the world: – Worldwide: $9.8M
 Mar 11, 2016 US and Canada: $506.7K Rest of the world: $8.2M Worldwide: $8.8M
 Mar 11, 2016 US and Canada: $24.1K Rest of the world: $7.6M Worldwide: $7.7M
 Mar 11, 2016 US and Canada: $6.5M Rest of the world: $839.9K Worldwide: $7.3M
 Mar 18, 2016 US and Canada: $3.7M Rest of the world: $3.4M Worldwide: $7.1M
 Mar 4, 2016 US and Canada: – Rest of the world: – Worldwide: $6.8M
 Mar 11, 2016 US and Canada: – Rest of the world: – Worldwide: $6.4M
 Mar 18, 2016 US and Canada: $124.8K Rest of the world: $4.6M Worldwide: $4.7M
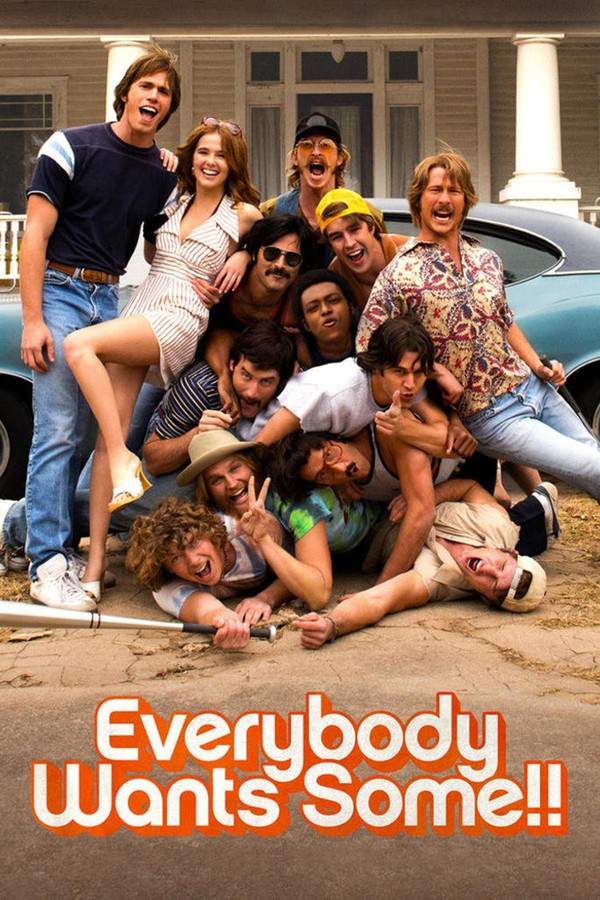 Mar 30, 2016 US and Canada: $3.4M Rest of the world: $1.2M Worldwide: $4.6M

 Mar 17, 2016 · Russian · Animation, Family $4.3M worldwide
 Mar 11, 2016 US and Canada: $1.2M Rest of the world: $3.1M Worldwide: $4.2M
 Mar 16, 2016 US and Canada: – Rest of the world: – Worldwide: $4.1M
 Mar 18, 2016 US and Canada: $13.1K Rest of the world: $3.3M Worldwide: $3.3M
 Mar 2, 2016 US and Canada: – Rest of the world: – Worldwide: $3.3M
 Mar 3, 2016 US and Canada: – Rest of the world: – Worldwide: $3.1M
 Mar 6, 2016 US and Canada: – Rest of the world: – Worldwide: $2.1M
 Mar 17, 2016 US and Canada: – Rest of the world: – Worldwide: $1.8M
 Mar 31, 2016 US and Canada: – Rest of the world: – Worldwide: $1.8M
 Mar 25, 2016 US and Canada: $1.6M Rest of the world: $121.2K Worldwide: $1.8M
 Mar 3, 2016 US and Canada: – Rest of the world: – Worldwide: $1.7M
 Mar 24, 2016 US and Canada: – Rest of the world: – Worldwide: $1.7M
 Mar 25, 2016 US and Canada: $830.1K Rest of the world: $723.2K Worldwide: $1.6M
 Mar 23, 2016 US and Canada: – Rest of the world: – Worldwide: $1.5M
 Mar 18, 2016 US and Canada: $269.1K Rest of the world: $1.2M Worldwide: $1.5M
 Mar 11, 2016 US and Canada: – Rest of the world: – Worldwide: $1.3M
 Mar 4, 2016 US and Canada: – Rest of the world: – Worldwide: $1.1M
 Mar 4, 2016 US and Canada: $566K Rest of the world: $460.3K Worldwide: $1M
 Mar 23, 2016 US and Canada: – Rest of the world: – Worldwide: $947.8K
 Mar 3, 2016 US and Canada: – Rest of the world: – Worldwide: $907.9K
Of the top 10, Miracles from Heaven (2016) earned the biggest share at home (83% in the US & Canada), while Forever Young (2016) made 100% of its gross abroad. Across all 140 films, $1B (36%) came from the US & Canada. 2 films of the top 10 report no US & Canada figure.
4 of 140 films crossed $100M and took $2.2B between them, 78% of the total. 121 films, 86% of the list, earned under $10M.
Films released in week 10 (Feb 28–Mar 5) took $1.4B, led by Zootopia (2016). Each column links to that week's chart; weeks are Sunday to Saturday.
Of these 10 years, March 2013 earned the most: $2.9B from 136 films, led by The Croods (2013). March 2016 took $2.9B.
| Month | Films | Worldwide | Change | Biggest film |
|---|---|---|---|---|
| March 2007 118 films | 118 | $1.9B | – | 300 (2007) $456.1M |
| March 2008 97 films · −24% | 97 | $1.4B | −24% | Horton Hears a Who! (2008) $298.6M |
| March 2009 101 films · −2% | 101 | $1.4B | −2% | Monsters vs Aliens (2009) $381.5M |
| March 2010 88 films · +56% | 88 | $2.2B | +56% | Alice in Wonderland (2010) $1B |
| March 2011 101 films · −25% | 101 | $1.6B | −25% | Rango (2011) $245.7M |
| March 2012 138 films · +66% | 138 | $2.7B | +66% | The Hunger Games (2012) $695.2M |
| March 2013 136 films · +9% | 136 | $2.9B | +9% | The Croods (2013) $587.3M |
| March 2014 116 films · −20% | 116 | $2.3B | −20% | Noah (2014) $359.2M |
| March 2015 113 films · −41% | 113 | $1.4B | −41% | Home (2015) $386M |
| March 2016 140 films · +107% | 140 | $2.9B | +107% | Zootopia (2016) $1B |
Action took $2.3B across 18 films, 81% of the total, ahead of Adventure ($2B) and Comedy ($1.4B). A film counts once for each of its genres. English-language films took $2.6B across 60 films, 90% of the total, ahead of Japanese-language films ($109.3M) and Italian-language films ($64.6M).











The months of 2016 with their totals: December leads with $4.6B, led by Rogue One: A Star Wars Story (2016).
The chart's numbers in short: the #1 film, the total, the billion-dollar hits and the US & Canada share, answered from the same 140 films as the chart.
Zootopia (2016) leads with $1B worldwide, $341.3M of it in the US & Canada. Next come Batman v Superman: Dawn of Justice (2016) at $874.4M and London Has Fallen (2016) at $205.8M.
140 films released in March 2016 report a worldwide gross, $2.9B in all, or $20.4M per film on average. February 2016 releases took $2B.
1 film crossed $1 billion worldwide: Zootopia (2016). 4 crossed $100 million.
Films are ranked by lifetime worldwide gross in US dollars, not adjusted for inflation, and grouped by their release date in March 2016. The figures are the reported box office grosses in our database. A gross that looks misattributed, such as one figure shared by two unrelated films or a blockbuster total on an obscure title, is left out rather than shown as a fact.
Grosses change while films are in theaters and whenever a new figure is reported; this chart reads the latest numbers in our database, so an older film can still move after a re-release.