
 #1 of 464
#1 comedy movie of 2013
2013 · Adventure, Sci-Fi
$970.8M worldwide · 9% of the chart's total
$368.1M US & Canada · 38% $602.7M elsewhere · 62%

Despicable Me 2 (2013) is the highest-grossing comedy movie released in 2013, with $970.8M worldwide, ahead of Monsters University (2013) at $743.6M and The Croods (2013) at $587.3M. 464 comedy films released in 2013 report a worldwide gross, $10.7B in all, 36% of it from the US & Canada. 28 films crossed $100 million; none reached $1 billion. That is up 5% on 2012, whose releases took $10.2B. By language, English leads with $8.4B across 161 comedy releases.
#1 of 464 2013 · Adventure, Sci-Fi
$970.8M worldwide · 9% of the chart's total
Despicable Me 2 (2013) leads with $970.8M, 9% of the total. The top 5 together took $3.1B, 29% of what all 464 films earned. Each bar splits a film's gross into the US & Canada and the rest of the world.
Number 1 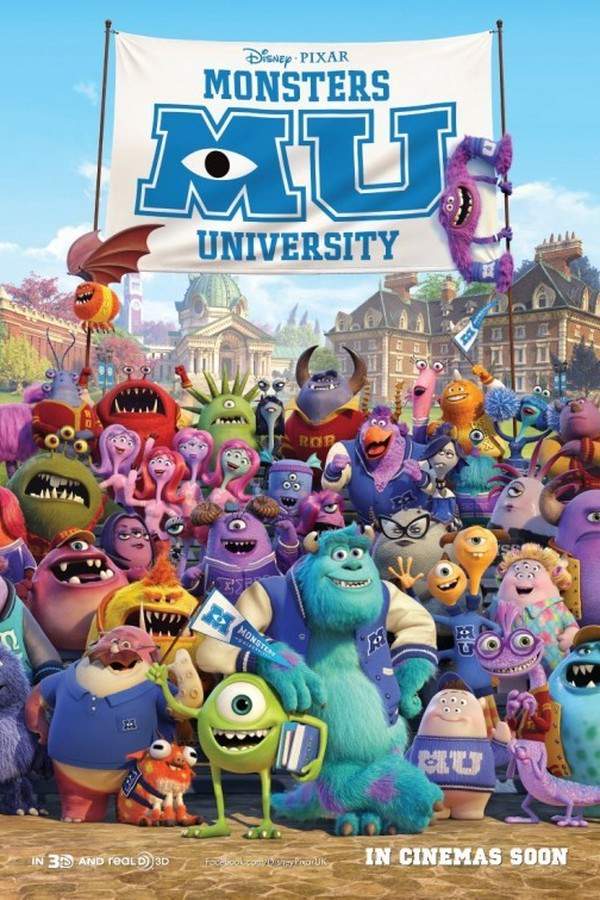 Number 2
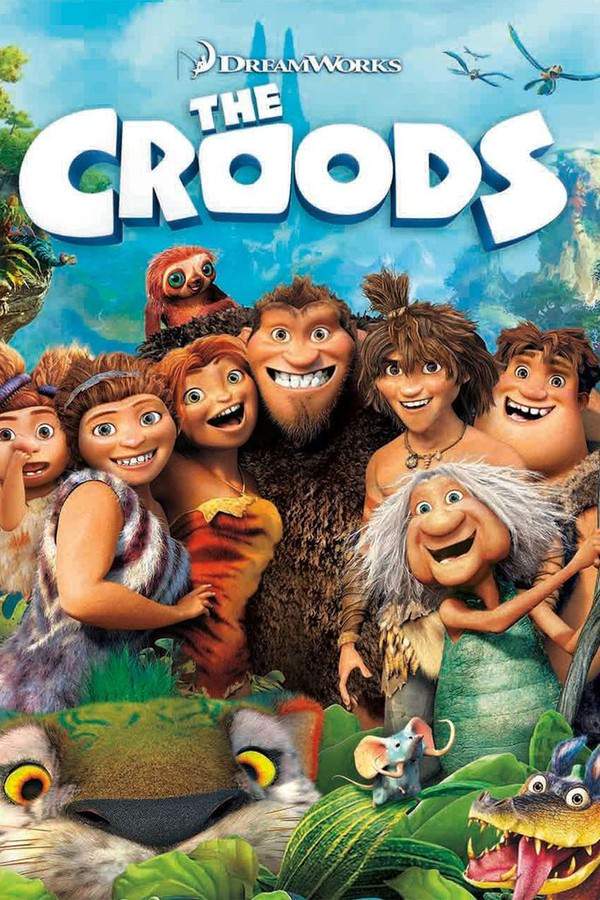 Number 3
 Number 4
 Number 5
US & Canada (domestic) Rest of the world
Ranks 1 to 50 of 464. Lifetime worldwide grosses in US dollars, not adjusted for inflation; domestic means the US & Canada. Films are grouped by their release date in 2013.
Jul 3, 2013 US and Canada: $368.1M Rest of the world: $602.7M Worldwide: $970.8M Jun 21, 2013 US and Canada: $268.5M Rest of the world: $475.1M Worldwide: $743.6M Mar 22, 2013 US and Canada: $187.2M Rest of the world: $400.1M Worldwide: $587.3M Dec 25, 2013 US and Canada: $116.9M Rest of the world: $290.1M Worldwide: $407M May 23, 2013 US and Canada: $112.2M Rest of the world: $249.8M Worldwide: $362M  Jul 31, 2013 US and Canada: $71M Rest of the world: $276.5M Worldwide: $347.5M
 Jul 17, 2013 US and Canada: $83M Rest of the world: $199.5M Worldwide: $282.6M
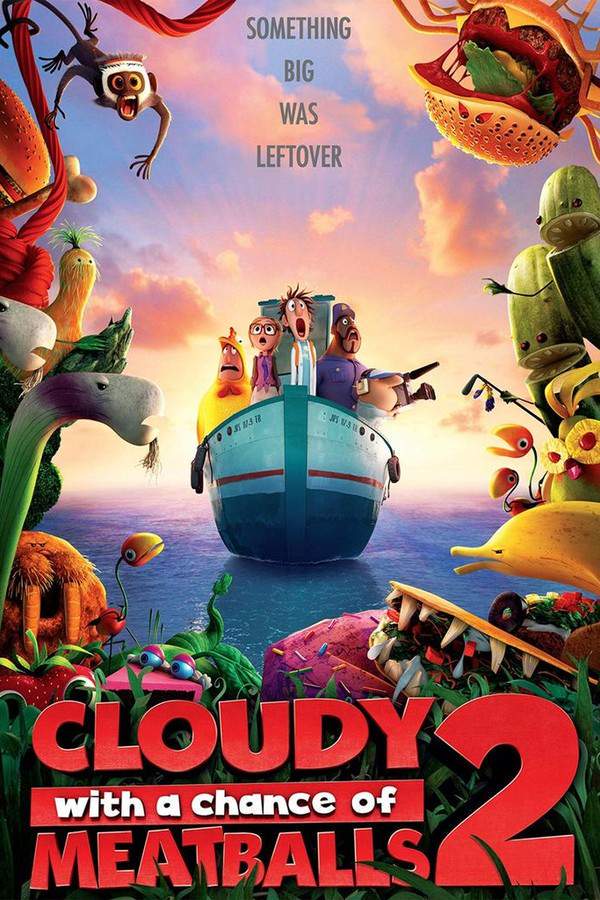
 Sep 27, 2013 · English · Sci-Fi, Fantasy, Comedy $274.3M worldwide
 Aug 7, 2013 US and Canada: $150.4M Rest of the world: $119.6M Worldwide: $270M
 May 24, 2013 US and Canada: $107.5M Rest of the world: $160.9M Worldwide: $268.4M
 Jul 12, 2013 US and Canada: $133.7M Rest of the world: $113.3M Worldwide: $247M
 Aug 9, 2013 US and Canada: $90.3M Rest of the world: $149.9M Worldwide: $240.2M
 Jun 28, 2013 US and Canada: $159.6M Rest of the world: $70.3M Worldwide: $229.9M
 Jan 25, 2013 · English · Action, Fantasy, Horror $226.3M worldwide
 Feb 8, 2013 US and Canada: $57.4K Rest of the world: $197.7M Worldwide: $197.8M
 Dec 25, 2013 · English · Adventure, Drama, Fantasy $188.1M worldwide
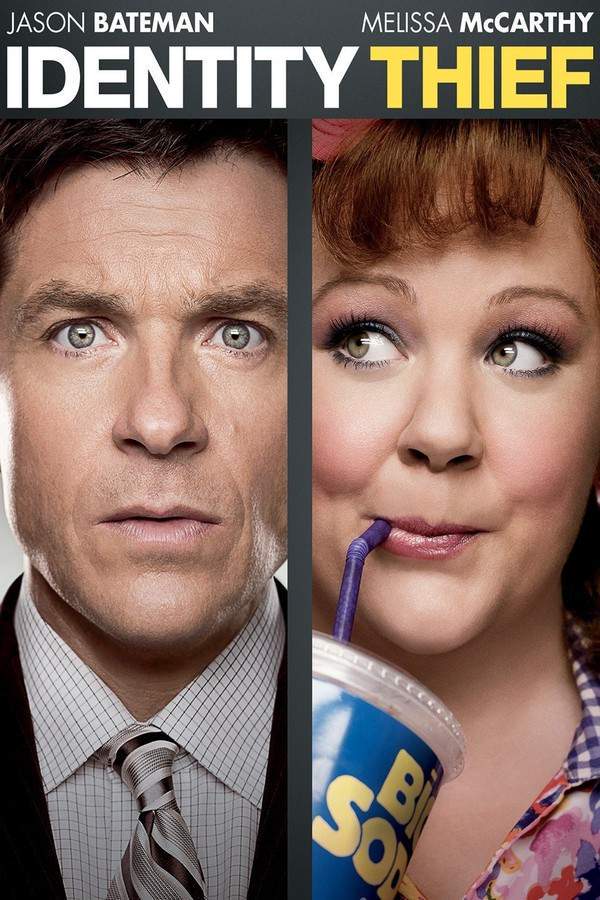 Feb 8, 2013 US and Canada: $134.5M Rest of the world: $39.5M Worldwide: $174M
 Dec 18, 2013 US and Canada: $127.4M Rest of the world: $46.3M Worldwide: $173.6M
 Oct 25, 2013 US and Canada: $102M Rest of the world: $49.8M Worldwide: $151.8M
 Jul 19, 2013 US and Canada: $53.3M Rest of the world: $94.8M Worldwide: $148.1M
 Nov 1, 2013 US and Canada: $63.9M Rest of the world: $70.5M Worldwide: $134.4M
 Aug 2, 2013 US and Canada: $75.6M Rest of the world: $56.3M Worldwide: $131.9M
 Jun 12, 2013 US and Canada: $101.5M Rest of the world: $24.6M Worldwide: $126M
 Dec 13, 2013 US and Canada: $83.3M Rest of the world: $34.6M Worldwide: $117.9M
 Feb 1, 2013 US and Canada: $66.4M Rest of the world: $50.6M Worldwide: $117M
 Dec 20, 2013 US and Canada: $375.9K Rest of the world: $115.8M Worldwide: $116.1M
 Nov 1, 2013 US and Canada: $55.8M Rest of the world: $54.6M Worldwide: $110.4M
 Aug 30, 2013 US and Canada: $44.5M Rest of the world: $56M Worldwide: $100.5M
 Jul 26, 2013 US and Canada: $33.4M Rest of the world: $65.7M Worldwide: $99.1M
 Jun 7, 2013 US and Canada: $44.7M Rest of the world: $48.8M Worldwide: $93.5M
 Apr 26, 2013 US and Canada: $49.9M Rest of the world: $37.4M Worldwide: $87.3M
 Nov 1, 2013 US and Canada: $15.3M Rest of the world: $71.8M Worldwide: $87.1M
 Nov 8, 2013 US and Canada: $6.9K Rest of the world: $84.1M Worldwide: $84.1M
 Jan 23, 2013 US and Canada: – Rest of the world: – Worldwide: $82.1M
 Apr 12, 2013 US and Canada: $32M Rest of the world: $46.4M Worldwide: $78.4M
 Jul 19, 2013 US and Canada: $33.6M Rest of the world: $44.7M Worldwide: $78.3M
 Nov 7, 2013 US and Canada: – Rest of the world: – Worldwide: $77.7M
 Feb 15, 2013 US and Canada: $57M Rest of the world: $17.9M Worldwide: $74.9M
 Dec 25, 2013 US and Canada: $37.7M Rest of the world: $36.5M Worldwide: $74.2M
 Nov 15, 2013 US and Canada: $70.5M Rest of the world: $2.3M Worldwide: $72.8M
 Aug 16, 2013 US and Canada: $28.8M Rest of the world: $32M Worldwide: $60.8M
 Jan 11, 2013 US and Canada: $40M Rest of the world: $20.1M Worldwide: $60.2M
 Dec 13, 2013 US and Canada: $52.5M Rest of the world: $853.3K Worldwide: $53.4M
 Nov 22, 2013 US and Canada: $30.7M Rest of the world: $22.5M Worldwide: $53.1M
 Dec 18, 2013 US and Canada: $25.6M Rest of the world: $22.7M Worldwide: $48.3M
 Mar 1, 2013 US and Canada: $25.7M Rest of the world: $22.4M Worldwide: $48.1M
 Apr 26, 2013 US and Canada: $21.8M Rest of the world: $24.7M Worldwide: $46.5M
 Jun 18, 2013 US and Canada: – Rest of the world: – Worldwide: $46.5M
 Aug 23, 2013 US and Canada: $26M Rest of the world: $20.1M Worldwide: $46.1M
 Dec 25, 2013 US and Canada: $29.8M Rest of the world: $15.1M Worldwide: $44.9M
Of the top 10, We're the Millers (2013) earned the biggest share at home (56% in the US & Canada), while The Smurfs 2 (2013) made 80% of its gross abroad. Across all 464 films, $3.9B (36%) came from the US & Canada.
28 of 464 films crossed $100M and took $7.4B between them, 69% of the total. 357 films, 77% of the list, earned under $10M.
July releases took the most, $2.3B from 44 films, led by Despicable Me 2 (2013). October was the quietest month ($233.2M). Each column is a release month and links to that month's chart.
Of these 10 years, 2013 earned the most: $10.7B from 464 films, led by Despicable Me 2 (2013).
| Year | Films | Worldwide | Change | Biggest film |
|---|---|---|---|---|
| 2004 327 films | 327 | $7.5B | – | Shrek 2 (2004) $932.5M |
| 2005 319 films · +7% | 319 | $8B | +7% | Madagascar (2005) $542.1M |
| 2006 387 films · +5% | 387 | $8.4B | +5% | Ice Age: The Meltdown (2006) $667.1M |
| 2007 447 films · +23% | 447 | $10.3B | +23% | Shrek the Third (2007) $808.3M |
| 2008 386 films · −10% | 386 | $9.3B | −10% | Mamma Mia! (2008) $703.2M |
| 2009 396 films · −1% | 396 | $9.2B | −1% | Ice Age: Dawn of the Dinosaurs (2009) $886.7M |
| 2010 399 films · +13% | 399 | $10.4B | +13% | Toy Story 3 (2010) $1.1B |
| 2011 427 films · −7% | 427 | $9.8B | −7% | Kung Fu Panda 2 (2011) $665.7M |
| 2012 457 films · +5% | 457 | $10.2B | +5% | Ice Age: Continental Drift (2012) $877.2M |
| 2013 464 films · +5% | 464 | $10.7B | +5% | Despicable Me 2 (2013) $970.8M |
English-language comedy films took $8.4B across 161 films, 78% of the total, ahead of Chinese-language comedy films ($585M) and Korean-language comedy films ($234.5M).


Every year from 1921 to 2026 with its total and its biggest film. 2019 leads with $16.1B, led by The Lion King (2019).
The chart's numbers in short: the #1 film, the total, the billion-dollar hits and the US & Canada share, answered from the same 464 films as the chart.
Despicable Me 2 (2013) leads with $970.8M worldwide, $368.1M of it in the US & Canada. Next come Monsters University (2013) at $743.6M and The Croods (2013) at $587.3M.
464 comedy films released in 2013 report a worldwide gross, $10.7B in all, or $23.1M per film on average. 2012 releases took $10.2B.
None. 28 films crossed $100 million, led by Despicable Me 2 (2013) with $970.8M.
Films are ranked by lifetime worldwide gross in US dollars, not adjusted for inflation, and grouped by their release date in 2013. The figures are the reported box office grosses in our database. A gross that looks misattributed, such as one figure shared by two unrelated films or a blockbuster total on an obscure title, is left out rather than shown as a fact.
Grosses change while films are in theaters and whenever a new figure is reported; this chart reads the latest numbers in our database, so an older film can still move after a re-release.