
 #1 of 19,808
Highest-grossing English-language movie ever
2009 · Action, Adventure
$2.9B worldwide
$785.2M US & Canada · 27% $2.1B elsewhere · 73%

Avatar (2009) is the highest-grossing English-language movie in our database, with $2.9B worldwide, ahead of Avengers: Endgame (2019) at $2.8B and Spider-Man: Brand New Day (2026) at $2.5B. 19,808 English-language films in our database report a worldwide gross, $667B in all, 47% of it from the US & Canada. 64 films crossed $1 billion and 1,633 crossed $100 million. By genre, Adventure leads with $299.6B across 2,003 English releases.
#1 of 19,808 2009 · Action, Adventure
$2.9B worldwide
Avatar (2009) leads with $2.9B, $124.3M ahead of Avengers: Endgame (2019). The top 5 were released between 1997 and 2026 and took $12.9B together; every one of them earned more than half of their gross outside the US & Canada.
Number 1  Number 2
 Number 3
 Number 4
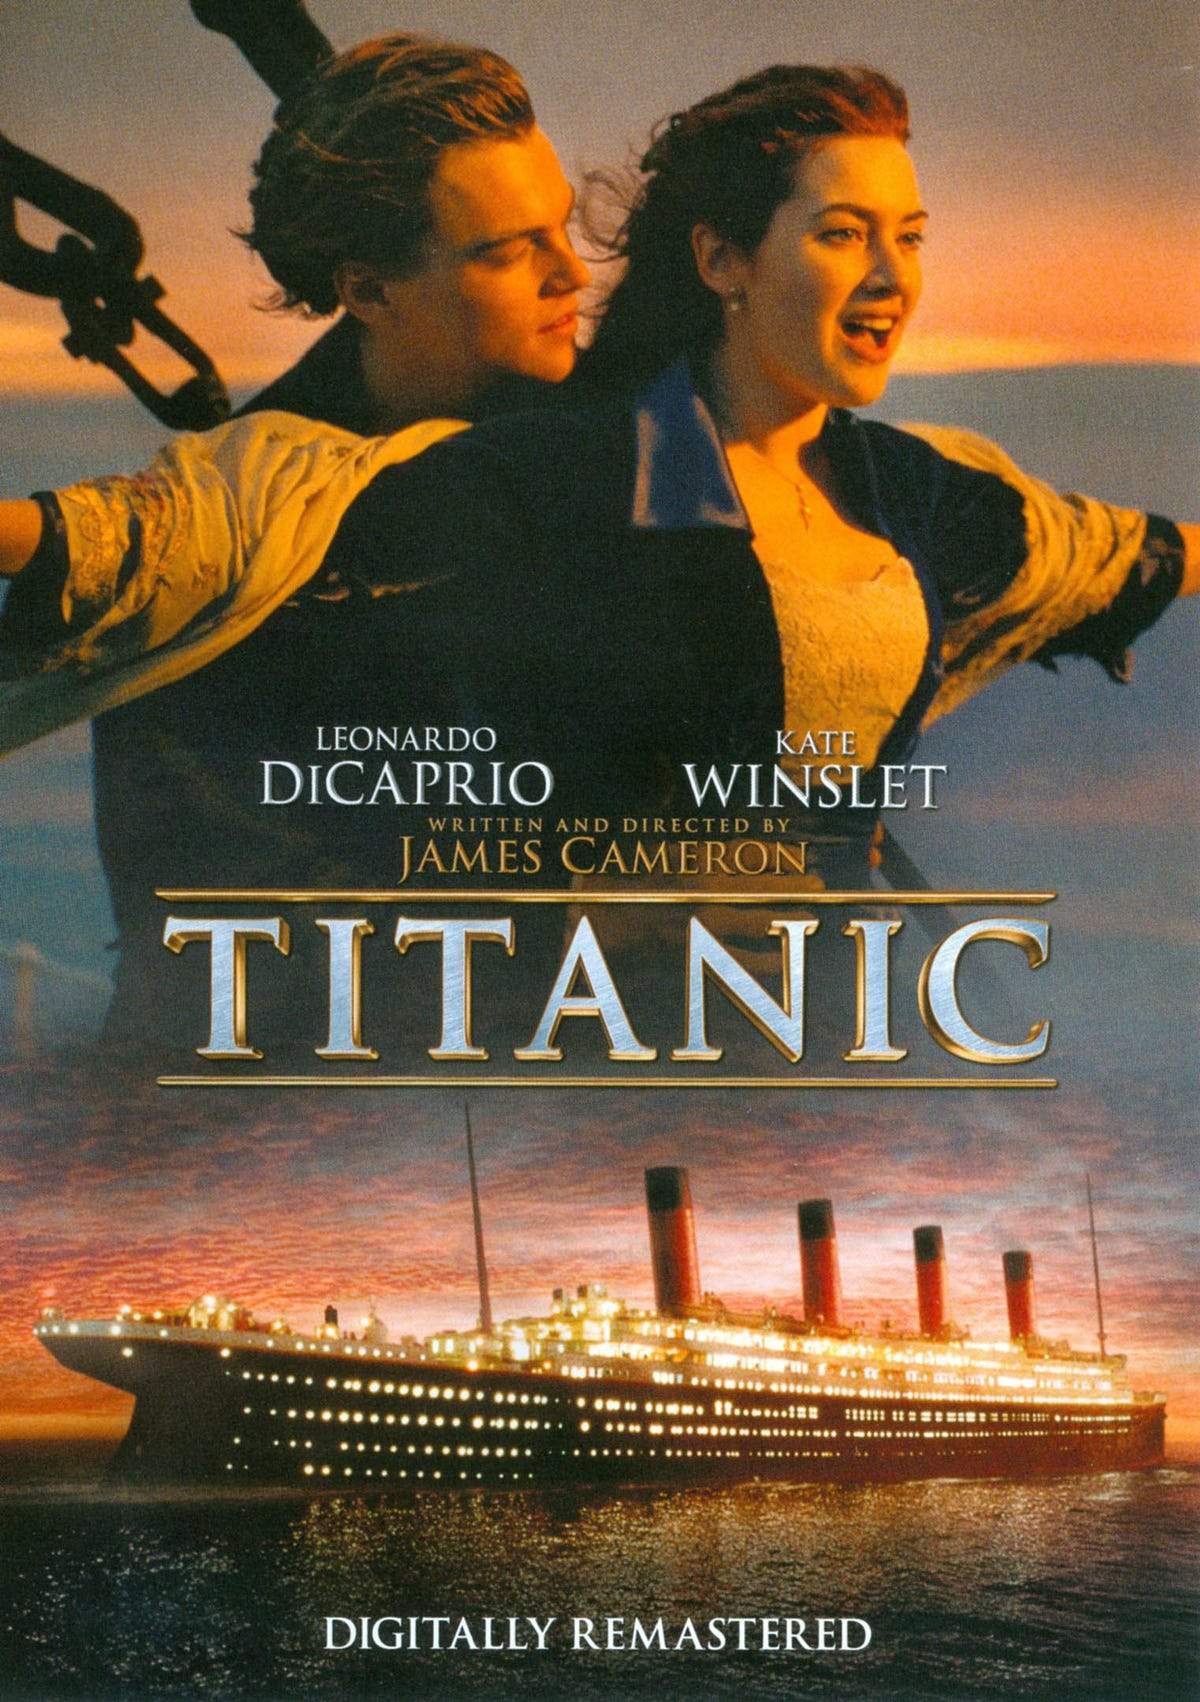 Number 5
US & Canada (domestic) Rest of the world
Ranks 1 to 50 of 5,000. Lifetime worldwide grosses in US dollars, not adjusted for inflation; domestic means the US & Canada. The pages stop at the top 5,000 of 19,808 films.
Dec 18, 2009 US and Canada: $785.2M Rest of the world: $2.1B Worldwide: $2.9B Apr 26, 2019 US and Canada: $858.4M Rest of the world: $1.9B Worldwide: $2.8B Jul 31, 2026 US and Canada: $958.8M Rest of the world: $1.6B Worldwide: $2.5B Dec 16, 2022 US and Canada: $688.5M Rest of the world: $1.7B Worldwide: $2.3B Dec 19, 1997 US and Canada: $674.4M Rest of the world: $1.6B Worldwide: $2.3B  Dec 18, 2015 US and Canada: $936.7M Rest of the world: $1.1B Worldwide: $2.1B
 Apr 27, 2018 US and Canada: $678.8M Rest of the world: $1.4B Worldwide: $2.1B
 Dec 17, 2021 US and Canada: $814.9M Rest of the world: $1.1B Worldwide: $1.9B
 Nov 26, 2025 US and Canada: $428.1M Rest of the world: $1.4B Worldwide: $1.9B
 Jul 17, 2026 US and Canada: $625.6M Rest of the world: $1.2B Worldwide: $1.8B
 Jun 14, 2024 US and Canada: $653M Rest of the world: $1B Worldwide: $1.7B
 Jun 12, 2015 US and Canada: $653.4M Rest of the world: $1B Worldwide: $1.7B
 Jul 19, 2019 US and Canada: $543.6M Rest of the world: $1.1B Worldwide: $1.7B
 May 4, 2012 US and Canada: $623.4M Rest of the world: $897.2M Worldwide: $1.5B
 Apr 3, 2015 US and Canada: $353M Rest of the world: $1.2B Worldwide: $1.5B
 Dec 19, 2025 US and Canada: $404.3M Rest of the world: $1.1B Worldwide: $1.5B
 Nov 22, 2019 US and Canada: $477.4M Rest of the world: $976.3M Worldwide: $1.5B
 Jul 21, 2023 US and Canada: $636.2M Rest of the world: $810.9M Worldwide: $1.4B
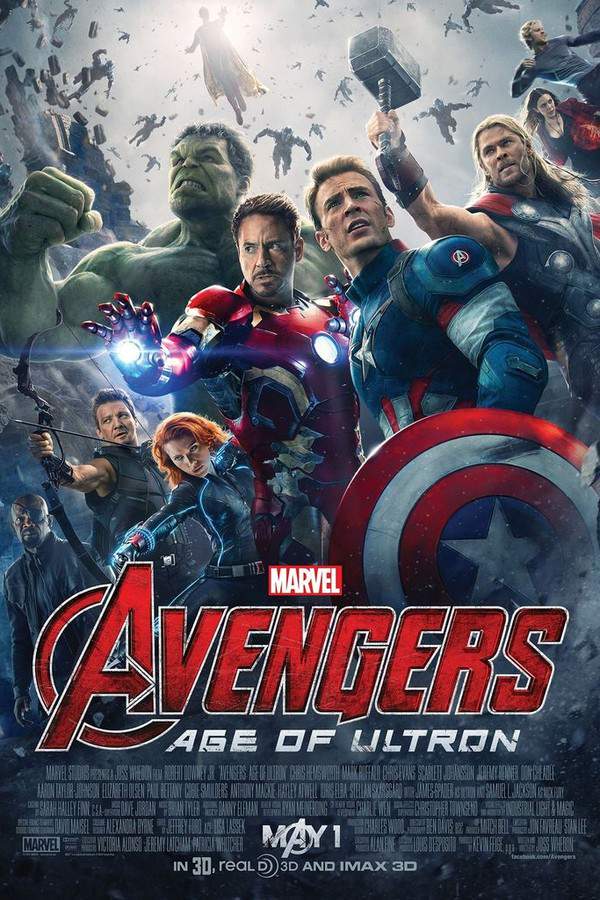 May 1, 2015 US and Canada: $459M Rest of the world: $946M Worldwide: $1.4B
 Apr 5, 2023 US and Canada: $574.9M Rest of the world: $785.8M Worldwide: $1.4B
 Feb 16, 2018 US and Canada: $700.4M Rest of the world: $649.5M Worldwide: $1.3B

 Jul 26, 2024 US and Canada: $636.7M Rest of the world: $701.3M Worldwide: $1.3B
 Dec 15, 2017 US and Canada: $620.2M Rest of the world: $714.2M Worldwide: $1.3B
 Jun 22, 2018 US and Canada: $417.7M Rest of the world: $892.7M Worldwide: $1.3B
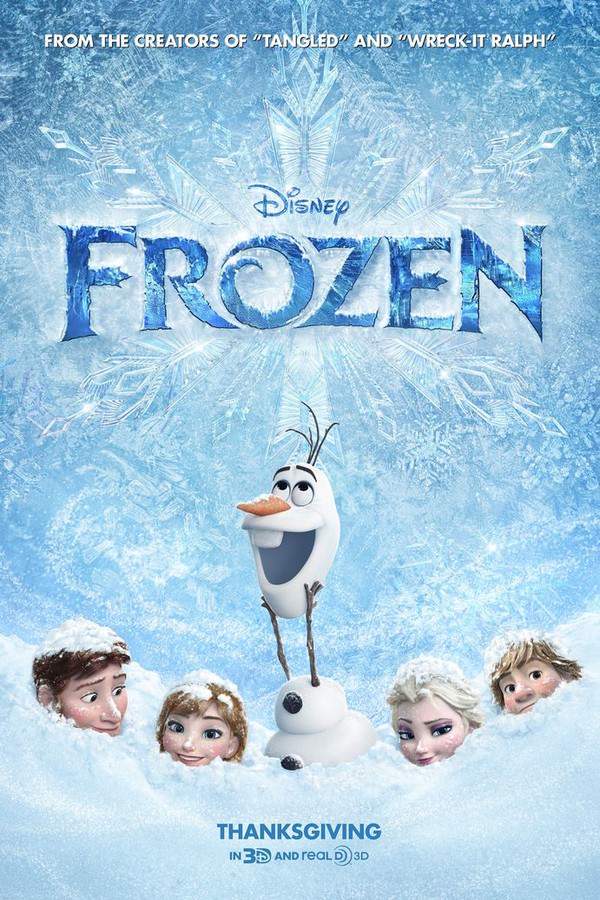 Nov 27, 2013 US and Canada: $401M Rest of the world: $909.4M Worldwide: $1.3B
 Mar 17, 2017 US and Canada: $504.5M Rest of the world: $761.6M Worldwide: $1.3B
 Jun 15, 2018 US and Canada: $608.6M Rest of the world: $634.6M Worldwide: $1.2B
 Apr 14, 2017 US and Canada: $226M Rest of the world: $1B Worldwide: $1.2B
 May 3, 2013 US and Canada: $409M Rest of the world: $806.6M Worldwide: $1.2B
 Jul 10, 2015 US and Canada: $336M Rest of the world: $823.4M Worldwide: $1.2B
 May 6, 2016 US and Canada: $408.1M Rest of the world: $747M Worldwide: $1.2B
 Dec 21, 2018 US and Canada: $335.1M Rest of the world: $816.9M Worldwide: $1.2B
 Jun 19, 2026 US and Canada: $480.3M Rest of the world: $668.8M Worldwide: $1.1B

 Jul 2, 2019 US and Canada: $391.3M Rest of the world: $741.4M Worldwide: $1.1B
 Mar 8, 2019 US and Canada: $426.8M Rest of the world: $704.6M Worldwide: $1.1B
 Jun 29, 2011 US and Canada: $352.4M Rest of the world: $771.4M Worldwide: $1.1B
 Jul 20, 2012 US and Canada: $448.1M Rest of the world: $666.8M Worldwide: $1.1B
 Nov 9, 2012 US and Canada: $304.4M Rest of the world: $804.2M Worldwide: $1.1B
 Jun 27, 2014 US and Canada: $245.4M Rest of the world: $859.8M Worldwide: $1.1B
 Oct 3, 2019 US and Canada: $335.5M Rest of the world: $743.5M Worldwide: $1.1B

 Jun 21, 2019 US and Canada: $434M Rest of the world: $639.8M Worldwide: $1.1B
 Jun 18, 2010 US and Canada: $415M Rest of the world: $652.3M Worldwide: $1.1B
 Jul 7, 2006 US and Canada: $423.3M Rest of the world: $642.9M Worldwide: $1.1B
 Nov 27, 2024 US and Canada: $460.4M Rest of the world: $598.8M Worldwide: $1.1B
 Dec 16, 2016 US and Canada: $533.5M Rest of the world: $525.1M Worldwide: $1.1B
 May 24, 2019 US and Canada: $355.6M Rest of the world: $698.7M Worldwide: $1.1B
 May 20, 2011 US and Canada: $241.1M Rest of the world: $805.6M Worldwide: $1B
Of the top 10, Star Wars: Episode VII - The Force Awakens (2015) earned the biggest share at home (45% in the US & Canada), while Zootopia 2 (2025) made 77% of its gross abroad. Across all 19,808 films, $313.8B (47%) came from the US & Canada.
1,633 of 19,808 films crossed $100M and took $512.5B between them, 77% of the total. 14,357 films, 72% of the list, earned under $10M.
Films released in the 2010s lead with $261B from 6,711 titles, led by Avengers: Endgame (2019). Each column links to the decade's biggest year.
2019 releases earned the most: $28.7B from 898 films, led by Avengers: Endgame (2019). The 10 biggest years, each linking to its chart.
| Year | Films | Worldwide | Biggest film |
|---|---|---|---|
| 2019 898 films | 898 | $28.7B | Avengers: Endgame (2019) $2.8B |
| 2018 828 films | 828 | $28.3B | Avengers: Infinity War (2018) $2.1B |
| 2017 771 films | 771 | $27.9B | Star Wars: Episode VIII - The Last Jedi (2017) $1.3B |
| 2016 695 films | 695 | $27.3B | Captain America: Civil War (2016) $1.2B |
| 2015 682 films | 682 | $27.1B | Star Wars: Episode VII - The Force Awakens (2015) $2.1B |
| 2012 576 films | 576 | $26B | The Avengers (2012) $1.5B |
| 2013 601 films | 601 | $26B | Frozen (2013) $1.3B |
| 2014 649 films | 649 | $24.6B | Transformers: Age Of Extinction (2014) $1.1B |
| 2011 544 films | 544 | $24.2B | Harry Potter and the Deathly Hallows: Part 2 (2011) $1.3B |
| 2009 490 films | 490 | $23B | Avatar (2009) $2.9B |
Adventure took $299.6B across 2,003 films, 45% of the total, ahead of Action ($289.5B) and Comedy ($241.3B). A film counts once for each of its genres.










Every year from 1919 to 2026 with its total and its biggest film. 2019 leads with $28.7B, led by Avengers: Endgame (2019).
The chart's numbers in short: the #1 film, the total, the billion-dollar hits and the US & Canada share, answered from the same 19,808 films as the chart.
Avatar (2009) leads with $2.9B worldwide, $785.2M of it in the US & Canada. Next come Avengers: Endgame (2019) at $2.8B and Spider-Man: Brand New Day (2026) at $2.5B.
19,808 English-language films in our database report a worldwide gross, $667B in all, or $33.7M per film on average.
64 films crossed $1 billion worldwide: Avatar (2009), Avengers: Endgame (2019), Spider-Man: Brand New Day (2026), Avatar: The Way of Water (2022) and Titanic (1997) among others. 1,633 crossed $100 million.
Films are ranked by lifetime worldwide gross in US dollars, not adjusted for inflation. The figures are the reported box office grosses in our database. A gross that looks misattributed, such as one figure shared by two unrelated films or a blockbuster total on an obscure title, is left out rather than shown as a fact, and so are films whose stored language is most likely wrong.
Grosses change while films are in theaters and whenever a new figure is reported; this chart reads the latest numbers in our database, so an older film can still move after a re-release.