
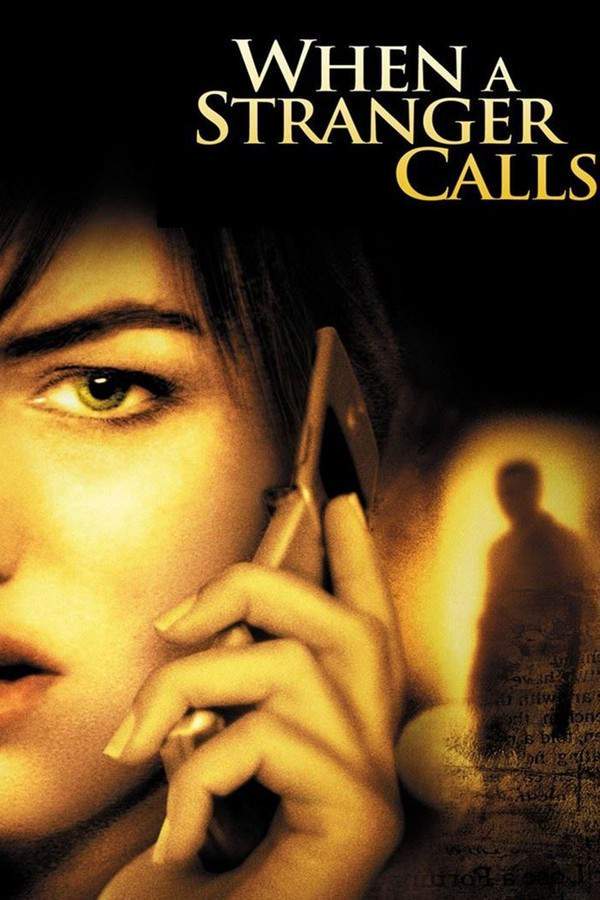
 #1 of 4
 #1 horror movie of Week 5, 2006
2006 · Thriller, Horror
$67.1M worldwide · 100% of the chart's total
$47.9M US & Canada · 71% $19.2M elsewhere · 29%

When a Stranger Calls (2006) is the highest-grossing horror movie released in week 5 of 2006 (Jan 29–Feb 4), with $67.1M worldwide, ahead of Tamara (2006) at $206.9K and The Strange Case of Dr. Jekyll and Mr. Hyde (2006) at $79.2K. 4 horror films released that week report a worldwide gross, $67.4M in all, 71% of it from the US & Canada.
#1 of 4 2006 · Thriller, Horror
$67.1M worldwide · 100% of the chart's total
When a Stranger Calls (2006) leads with $67.1M, 100% of the total. The top 4 together took $67.4M, almost all of what the 4 films earned. Each bar splits a film's gross into the US & Canada and the rest of the world.
Number 1  Number 2
  Number 3
  Number 4
 US & Canada (domestic) Rest of the world
Lifetime worldwide grosses in US dollars, not adjusted for inflation; domestic means the US & Canada. Films are grouped by their release date in week 5 of 2006 (Jan 29–Feb 4).
Feb 3, 2006 US and Canada: $47.9M Rest of the world: $19.2M Worldwide: $67.1M Feb 3, 2006 US and Canada: $206.9K Rest of the world: Worldwide: $206.9K  Feb 1, 2006 · English · Horror, Thriller $79.2K worldwide Jan 31, 2006 US and Canada: $11.3K Rest of the world: Worldwide: $11.3K
 Of the top 4, Tamara (2006) earned the biggest share at home (100% in the US & Canada), while The Strange Case of Dr. Jekyll and Mr. Hyde (2006) made 69% of its gross abroad. Across all 4 films, $48.1M (71%) came from the US & Canada.
Week 5 releases took $67.4M. The biggest of these 9 weeks is week 6 (Feb 5–11) with $131.8M, led by Final Destination 3 (2006).
Of these 10 years, Week 5, 2005 earned the most: $140.1M from 2 films, led by Hide and Seek (2005). Week 5, 2006 took $67.4M.
| Week | Films | Worldwide | Change | Biggest film |
|---|---|---|---|---|
| Week 5, 1997 Jan 26–Feb 1 No films | 0 | – | – | – |
| Week 5, 1998 Jan 25–31 2 films | 2 | $11.6M | – | Deep Rising (1998) $11.2M |
| Week 5, 1999 Jan 24–30 No films | 0 | – | – | – |
| Week 5, 2000 Jan 23–29 No films | 0 | – | – | – |
| Week 5, 2001 Jan 28–Feb 3 1 film | 1 | $36.7M | – | Valentine (2001) $36.7M |
| Week 5, 2002 Jan 27–Feb 2 No films | 0 | – | – | – |
| Week 5, 2003 Jan 26–Feb 1 1 film | 1 | $90.9M | – | Final Destination 2 (2003) $90.9M |
| Week 5, 2004 Jan 25–31 1 film · −99% | 1 | $943.6K | −99% | Ginger Snaps 2: Unleashed (2004) $943.6K |
| Week 5, 2005 Jan 23–29 2 films · +14743% | 2 | $140.1M | +14743% | Hide and Seek (2005) $127.4M |
| Week 5, 2006 Jan 29–Feb 4 4 films · −52% | 4 | $67.4M | −52% | When a Stranger Calls (2006) $67.1M |
44 weeks of 2006 with reported grosses; the biggest is week 43 (Oct 22–28) with $169.8M, led by Saw III (2006).
The chart's numbers in short: the #1 film, the total, the billion-dollar hits and the US & Canada share, answered from the same 4 films as the chart.
When a Stranger Calls (2006) leads with $67.1M worldwide, $47.9M of it in the US & Canada. Next come Tamara (2006) at $206.9K and The Strange Case of Dr. Jekyll and Mr. Hyde (2006) at $79.2K.
4 horror films released in week 5 of 2006 (Jan 29–Feb 4) report a worldwide gross, $67.4M in all, or $16.8M per film on average.
None. The biggest, When a Stranger Calls (2006), earned $67.1M.
Films are ranked by lifetime worldwide gross in US dollars, not adjusted for inflation, and grouped by their release date in week 5 of 2006 (Jan 29–Feb 4). The figures are the reported box office grosses in our database. A gross that looks misattributed, such as one figure shared by two unrelated films or a blockbuster total on an obscure title, is left out rather than shown as a fact.
Grosses change while films are in theaters and whenever a new figure is reported; this chart reads the latest numbers in our database, so an older film can still move after a re-release.