
 #1 of 1,728
Highest-grossing history movie ever
2026 · Biography, Drama
$1B worldwide
$372.3M US & Canada · 36% $656.4M elsewhere · 64%

Michael (2026) is the highest-grossing history movie in our database, with $1B worldwide, ahead of Oppenheimer (2023) at $975.8M and Full River Red (2023) at $670.5M. 1,728 history films in our database report a worldwide gross, $29.1B in all, 34% of it from the US & Canada. 1 film crossed $1 billion and 68 crossed $100 million. By language, English leads with $19.4B across 750 history releases.
#1 of 1,728 2026 · Biography, Drama
$1B worldwide
Michael (2026) leads with $1B, $52.9M ahead of Oppenheimer (2023). The top 5 were released between 2004 and 2026 and took $3.8B together; 3 earned more than half of their gross outside the US & Canada.
Number 1  Number 2
 Number 3
 Number 4
 Number 5
US & Canada (domestic) Rest of the world
Ranks 1 to 50 of 1,728. Lifetime worldwide grosses in US dollars, not adjusted for inflation; domestic means the US & Canada.
Apr 24, 2026 US and Canada: $372.3M Rest of the world: $656.4M Worldwide: $1B Jul 21, 2023 US and Canada: $330.1M Rest of the world: $645.7M Worldwide: $975.8M Mar 17, 2023 US and Canada: – Rest of the world: – Worldwide: $670.5M Feb 25, 2004 US and Canada: $370.8M Rest of the world: $239.3M Worldwide: $610.1M Jul 21, 2017 US and Canada: $189.7M Rest of the world: $344M Worldwide: $533.7M  May 5, 2000 US and Canada: $187.7M Rest of the world: $277.8M Worldwide: $465.5M
 Dec 5, 2003 US and Canada: $111.1M Rest of the world: $343.5M Worldwide: $454.6M
 Oct 1, 2019 US and Canada: $2.4M Rest of the world: $447.7M Worldwide: $450.1M
 Aug 15, 2025 US and Canada: – Rest of the world: – Worldwide: $422.8M
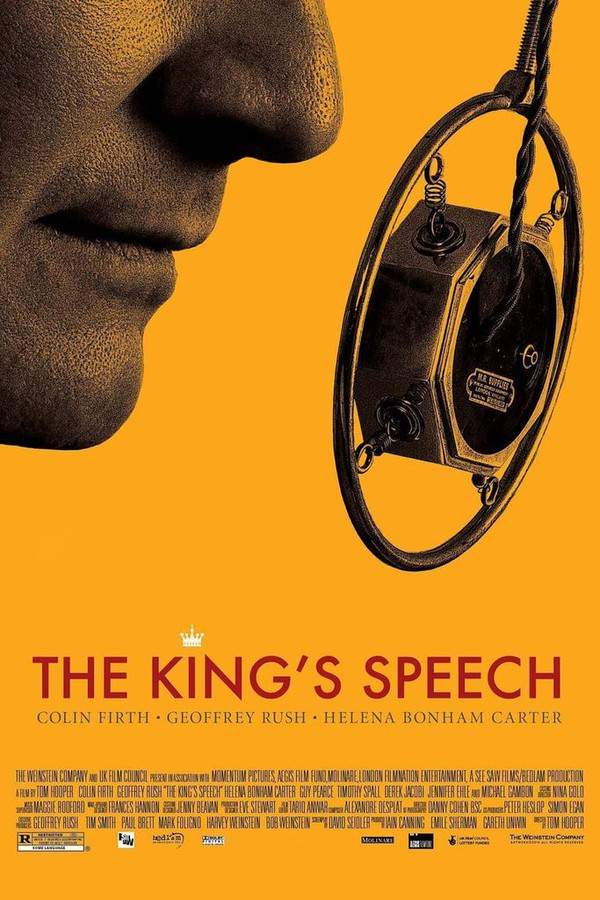 Nov 26, 2010 US and Canada: $138.8M Rest of the world: $275.7M Worldwide: $414.5M
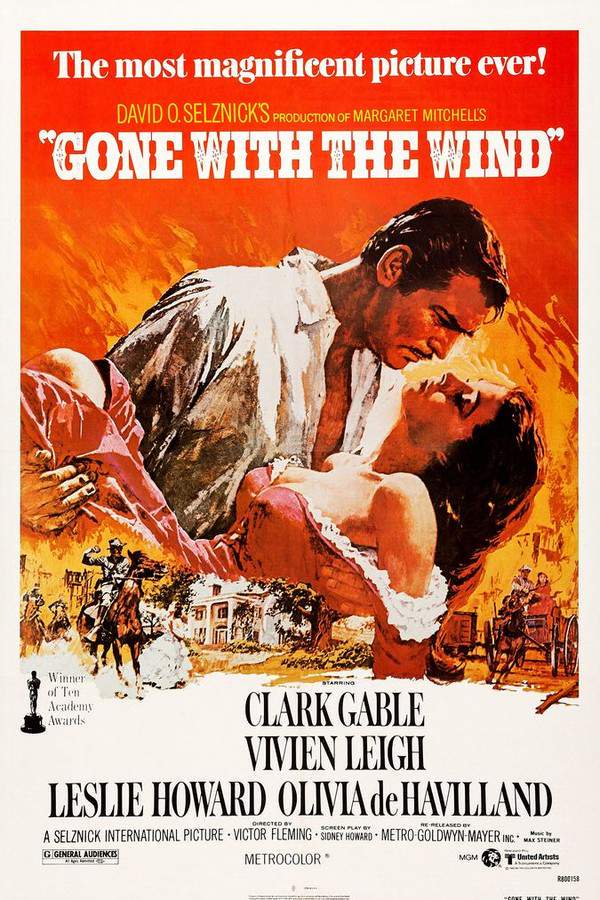 Jan 17, 1940 US and Canada: $200.9M Rest of the world: $201.5M Worldwide: $402.4M

 Jul 26, 2019 · English · Drama, History, Mystery $392.1M worldwide
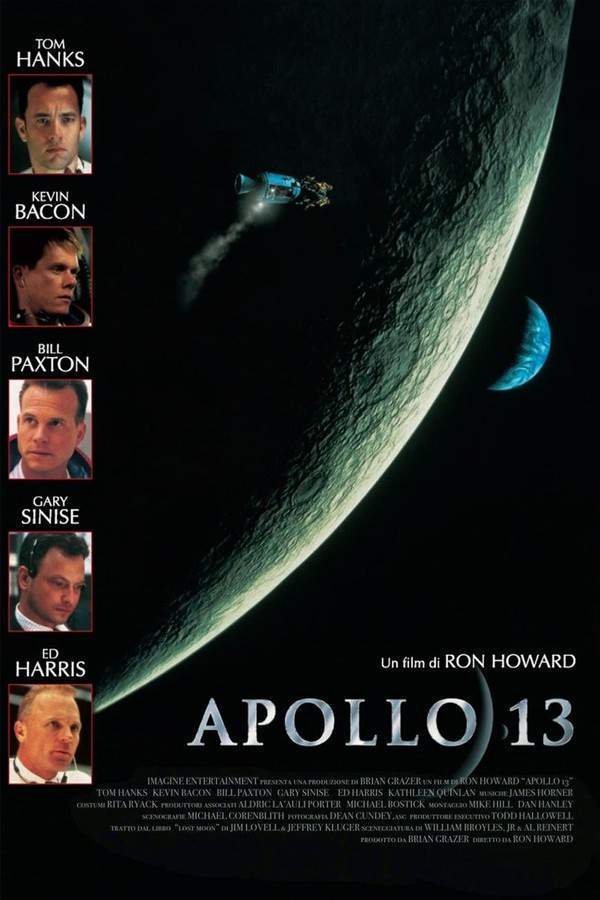 Jun 30, 1995 US and Canada: $173.8M Rest of the world: $181.4M Worldwide: $355.2M
 Jun 23, 1995 US and Canada: $141.6M Rest of the world: $204.5M Worldwide: $346.1M
 Dec 15, 1993 US and Canada: $96.9M Rest of the world: $225.3M Worldwide: $322.2M
 Nov 16, 2018 US and Canada: $85.1M Rest of the world: $236.7M Worldwide: $321.8M
 Dec 21, 2016 US and Canada: $12.4M Rest of the world: $291.3M Worldwide: $303.7M
 Nov 9, 2012 US and Canada: $182.2M Rest of the world: $93.1M Worldwide: $275.3M
 Sep 19, 2025 US and Canada: $410.9K Rest of the world: $273.7M Worldwide: $274.1M
 Dec 13, 2013 US and Canada: $150.1M Rest of the world: $101.1M Worldwide: $251.2M
 Jul 4, 2023 US and Canada: $184.2M Rest of the world: $66.4M Worldwide: $250.6M
 Dec 21, 2016 US and Canada: $54.6M Rest of the world: $186M Worldwide: $240.7M
 Sep 14, 2012 · English · Action, Adventure, Sci-Fi $240.2M worldwide
 Dec 25, 2016 US and Canada: $169.6M Rest of the world: $66.4M Worldwide: $236M
 Oct 1, 2010 US and Canada: $97M Rest of the world: $128M Worldwide: $224.9M
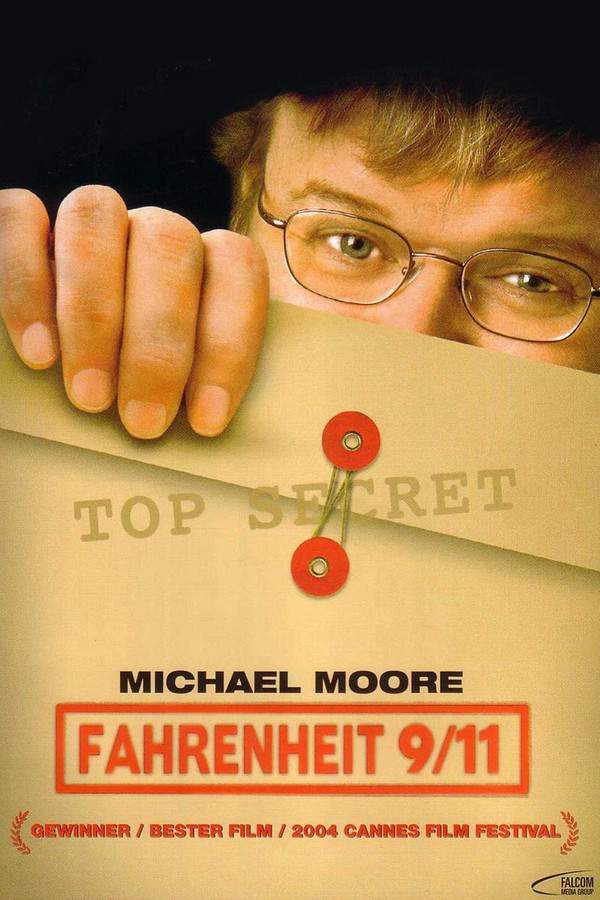 Jun 23, 2004 US and Canada: $119.2M Rest of the world: $103.3M Worldwide: $222.4M
 Nov 22, 2023 US and Canada: $61.5M Rest of the world: $160.9M Worldwide: $222.4M
 May 6, 2005 US and Canada: $47.5M Rest of the world: $170.8M Worldwide: $218.4M
 Jul 1, 2009 US and Canada: $97.1M Rest of the world: $117M Worldwide: $214.1M
 May 24, 1995 US and Canada: $75.6M Rest of the world: $137.6M Worldwide: $213.2M
 Nov 14, 2008 US and Canada: $49.6M Rest of the world: $162.2M Worldwide: $211.8M
 Dec 20, 1991 US and Canada: $70.4M Rest of the world: $135M Worldwide: $205.4M
 Jul 7, 2004 US and Canada: $51.9M Rest of the world: $151.7M Worldwide: $203.6M
 Sep 18, 2015 US and Canada: $43.5M Rest of the world: $159.9M Worldwide: $203.4M
 Dec 25, 2008 US and Canada: $83.1M Rest of the world: $118.5M Worldwide: $201.5M
 Dec 21, 2012 US and Canada: $19M Rest of the world: $179.1M Worldwide: $198.1M
 Dec 20, 2002 US and Canada: $77.8M Rest of the world: $116M Worldwide: $193.8M
 Dec 22, 2017 US and Canada: $81.9M Rest of the world: $111.9M Worldwide: $193.8M
 Oct 18, 2013 US and Canada: $56.7M Rest of the world: $131.1M Worldwide: $187.7M
 Mar 13, 1998 US and Canada: $57M Rest of the world: $126M Worldwide: $183M
 Apr 30, 2021 US and Canada: $153K Rest of the world: $181.2M Worldwide: $181.3M
 Nov 4, 2016 US and Canada: $67.2M Rest of the world: $113.4M Worldwide: $180.6M
 Dec 25, 2019 US and Canada: $4M Rest of the world: $172.4M Worldwide: $176.3M
 Oct 16, 2015 US and Canada: $72.3M Rest of the world: $93.2M Worldwide: $165.5M
 Aug 9, 2006 US and Canada: $70.3M Rest of the world: $93M Worldwide: $163.2M
 Dec 25, 2014 US and Canada: $115.6M Rest of the world: $45.8M Worldwide: $161.5M
 Oct 20, 2023 US and Canada: $68M Rest of the world: $90.7M Worldwide: $158.8M
 Jan 22, 2016 US and Canada: $2.7M Rest of the world: $154.4M Worldwide: $157M
 Sep 30, 2019 US and Canada: $487.2K Rest of the world: $156.4M Worldwide: $156.9M
 Nov 22, 2017 US and Canada: $56.5M Rest of the world: $94.4M Worldwide: $150.8M
Of the top 10, The Passion of the Christ (2004) earned the biggest share at home (61% in the US & Canada), while My People, My Country (2019) made 99% of its gross abroad. Across all 1,728 films, $9.8B (34%) came from the US & Canada. 2 films of the top 10 report no US & Canada figure.
68 of 1,728 films crossed $100M and took $17.4B between them, 60% of the total. 1,380 films, 80% of the list, earned under $10M.
Films released in the 2010s lead with $11.6B from 752 titles, led by Dunkirk (2017). Each column links to the decade's biggest year.
2023 releases earned the most: $2.8B from 80 films, led by Oppenheimer (2023). The 10 biggest years, each linking to its chart.
| Year | Films | Worldwide | Biggest film |
|---|---|---|---|
| 2023 80 films | 80 | $2.8B | Oppenheimer (2023) $975.8M |
| 2016 88 films | 88 | $1.8B | Dangal (2016) $303.7M |
| 2019 120 films | 120 | $1.8B | My People, My Country (2019) $450.1M |
| 2017 100 films | 100 | $1.7B | Dunkirk (2017) $533.7M |
| 2018 90 films | 90 | $1.2B | Green Book (2018) $321.8M |
| 2004 35 films | 35 | $1.2B | The Passion of the Christ (2004) $610.1M |
| 2012 44 films | 44 | $1.2B | Lincoln (2012) $275.3M |
| 2025 48 films | 48 | $1.1B | Dead to Rights (2025) $422.8M |
| 2026 19 films | 19 | $1.1B so far | Michael (2026) $1B |
| 2015 81 films | 81 | $1.1B | Everest (2015) $203.4M |
English-language history films took $19.4B across 750 films, 67% of the total, ahead of Chinese-language history films ($3.5B) and Korean-language history films ($1.1B).


Every year from 1918 to 2026 with its total and its biggest film. 2023 leads with $2.8B, led by Oppenheimer (2023).
The chart's numbers in short: the #1 film, the total, the billion-dollar hits and the US & Canada share, answered from the same 1,728 films as the chart.
Michael (2026) leads with $1B worldwide, $372.3M of it in the US & Canada. Next come Oppenheimer (2023) at $975.8M and Full River Red (2023) at $670.5M.
1,728 history films in our database report a worldwide gross, $29.1B in all, or $16.8M per film on average.
1 film crossed $1 billion worldwide: Michael (2026). 68 crossed $100 million.
Films are ranked by lifetime worldwide gross in US dollars, not adjusted for inflation. The figures are the reported box office grosses in our database. A gross that looks misattributed, such as one figure shared by two unrelated films or a blockbuster total on an obscure title, is left out rather than shown as a fact.
Grosses change while films are in theaters and whenever a new figure is reported; this chart reads the latest numbers in our database, so an older film can still move after a re-release.