 #1 of 6
 #1 movie of Week 22, 2001
2001 · Comedy
$85.2M worldwide · 68% of the chart's total
$57.7M US & Canada · 68% $27.4M elsewhere · 32%
The Animal (2001) is the highest-grossing movie released in week 22 of 2001 (May 27–Jun 2), with $85.2M worldwide, ahead of What's the Worst That Could Happen? (2001) at $38.5M and Big Eden (2001) at $512.5K. 6 films released that week report a worldwide gross, $124.4M in all, 73% of it from the US & Canada. That is down 72% on Week 21, 2001, whose releases took $450.8M. By genre, Comedy leads with $123.7M across 3 releases.
#1 of 6 2001 · Comedy
$85.2M worldwide · 68% of the chart's total
The Animal (2001) leads with $85.2M, 68% of the total. The top 5 together took $124.4M, almost all of what the 6 films earned. Each bar splits a film's gross into the US & Canada and the rest of the world.
Number 1 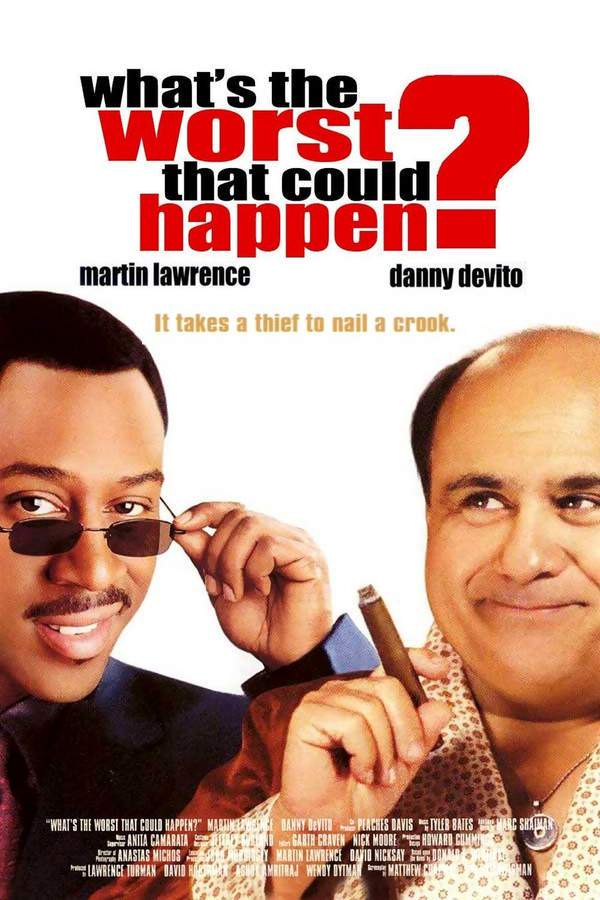 Number 2
  Number 3
  Number 4
  Number 5
 US & Canada (domestic) Rest of the world
Lifetime worldwide grosses in US dollars, not adjusted for inflation; domestic means the US & Canada. Films are grouped by their release date in week 22 of 2001 (May 27–Jun 2).
Jun 1, 2001 US and Canada: $57.7M Rest of the world: $27.4M Worldwide: $85.2M Jun 1, 2001 US and Canada: $32.3M Rest of the world: $6.2M Worldwide: $38.5M Jun 1, 2001 US and Canada: $512.5K Rest of the world: Worldwide: $512.5K Jun 1, 2001 US and Canada: – Rest of the world: – Worldwide: $189.1K May 27, 2001 US and Canada: – Rest of the world: – Worldwide: $45.9K  Jun 1, 2001 US and Canada: – Rest of the world: – Worldwide: $40.8K
 Of the top 6, Big Eden (2001) earned the biggest share at home (100% in the US & Canada), while The Animal (2001) made 32% of its gross abroad. Across all 6 films, $90.5M (73%) came from the US & Canada. 3 films of the top 6 report no US & Canada figure.
Week 22 releases took $124.4M. The biggest of these 9 weeks is week 20 (May 13–19) with $704.1M, led by Shrek (2001).
Of these 10 years, Week 22, 2000 earned the most: $647.6M from 9 films, led by Mission: Impossible II (2000). Week 22, 2001 took $124.4M.
| Week | Films | Worldwide | Change | Biggest film |
|---|---|---|---|---|
| Week 22, 1992 May 24–30 2 films | 2 | $238.2M | – | Sister Act (1992) $231.6M |
| Week 22, 1993 May 23–29 8 films · +82% | 8 | $432.8M | +82% | Cliffhanger (1993) $255M |
| Week 22, 1994 May 22–28 5 films · +7% | 5 | $462.6M | +7% | The Flintstones (1994) $341.6M |
| Week 22, 1995 May 28–Jun 3 3 films · −60% | 3 | $186.2M | −60% | The Bridges of Madison County (1995) $182M |
| Week 22, 1996 May 26–Jun 1 3 films · −14% | 3 | $160.7M | −14% | DragonHeart (1996) $115.3M |
| Week 22, 1997 May 25–31 2 films · −91% | 2 | $14.6M | −91% | Trial and Error (1997) $14.6M |
| Week 22, 1998 May 24–30 4 films · +591% | 4 | $100.9M | +591% | Hope Floats (1998) $81.5M |
| Week 22, 1999 May 23–29 5 films · +279% | 5 | $382.9M | +279% | Notting Hill (1999) $364M |
| Week 22, 2000 May 21–27 9 films · +69% | 9 | $647.6M | +69% | Mission: Impossible II (2000) $546.4M |
| Week 22, 2001 May 27–Jun 2 6 films · −81% | 6 | $124.4M | −81% | The Animal (2001) $85.2M |
53 weeks of 2001 with reported grosses; the biggest is week 51 (Dec 16–22) with $1.5B, led by The Lord of the Rings: The Fellowship of the Ring (2001).
The chart's numbers in short: the #1 film, the total, the billion-dollar hits and the US & Canada share, answered from the same 6 films as the chart.
The Animal (2001) leads with $85.2M worldwide, $57.7M of it in the US & Canada. Next come What's the Worst That Could Happen? (2001) at $38.5M and Big Eden (2001) at $512.5K.
6 films released in week 22 of 2001 (May 27–Jun 2) report a worldwide gross, $124.4M in all, or $20.7M per film on average. Week 21, 2001 releases took $450.8M.
None. The biggest, The Animal (2001), earned $85.2M.
Films are ranked by lifetime worldwide gross in US dollars, not adjusted for inflation, and grouped by their release date in week 22 of 2001 (May 27–Jun 2). The figures are the reported box office grosses in our database. A gross that looks misattributed, such as one figure shared by two unrelated films or a blockbuster total on an obscure title, is left out rather than shown as a fact.
Grosses change while films are in theaters and whenever a new figure is reported; this chart reads the latest numbers in our database, so an older film can still move after a re-release.